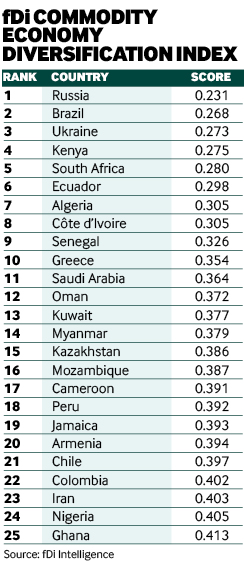
Russia’s score of 0.231 in 2019’s Diversification Index from fDi Magazine places it firmly at the top of the table once again. The eastern European country attracted almost 4900 projects in the five years to 2018 across 39 sectors, according to greenfield investment monitor fDi Markets.
Russia looks to be continuing its shift from service-based FDI to more industrial operations. Between 2009 and 2013, FDI in the industrial equipment sector accounted for 14% of all FDI in Russia. In the 2014 to 2018 period, this figure had risen to almost one-fifth. Comparing the same periods, FDI in the food and tobacco sector in Russia increased from a 10% share to 22% and chemicals from 7% to 11%. Conversely, financial services made up 15% of all Russian FDI between 2009 and 2013, and was its top ranked sector in terms of FDI projects. By 2014 to 2018, this figure had fallen to 5%, while business services fell from 12% (118 projects) to 4%, or 27 projects.
Advertisement
Brazil's broad appeal
Brazil, a newcomer to the index, welcomed more than 4500 projects across 39 sectors in the five years to 2018. Software and IT services was the highest performing sector between 2014 and 2018, making up 13% of all Brazilian FDI. Business services was second with almost one-tenth (421 projects) and industrial equipment 342 projects, or 7.5% of all Brazil’s FDI. More than one-third of all Brazil’s investments were in manufacturing operations, with one-quarter in sales, marketing and support projects and 14% in business services.
Ukraine ranks third in this year’s index, down from second place. More than 1000 projects were announced in Ukraine between 2003 and 2018, across 38 sectors. More than 40% of all FDI job creation in the country derived from manufacturing operations, including a 3000-job investment by US-based electronic cable manufacturer Tyco International. Meanwhile, France-based Nexans created 2000 jobs in a new plant in Brody, a city in western Ukraine’s Lviv oblast.
In total, 41 locations were ranked on the level of diversification in their FDI. A strong correlation exists between the number of FDI projects a commodity economy receives and how diversified it is. Broadly speaking, the higher the number of investments, the more diversified a location is likely to be.
The index analysed 41 commodity economies across 39 FDI sectors to determine how diversified their levels of greenfield FDI have been since 2003.
Methodology
Advertisement
fDi used the Hirschman Index for export diversification as a base and calculated a score for FDI projects and capital investment using data from greenfield investment monitor fDi Markets.
The scores for each location ranged between zero (fully diversified) and one (fully specialised). The lower the score, the more diversified the economy is in terms of FDI; the higher the score, the more concentrated.
The fDi Diversification Index is a weighted average of the fDi Diversification Score for FDI projects and FDI capital investment. For FDI projects, the result is the square root of the sum of the square of the number of projects in sector x, divided by the total number of projects, for each of the sectors whereby the location receives FDI. The index then applies equal weight (50%:50%) to both projects and capital investment figures to give the overall index score.
The list of locations was devised by analysing economies with at least 40% of their goods exports derived from the commodities* and a minimum of 25 inward greenfield FDI projects. Thirty-three economies met the criteria.
* HS codes included 9-10; 17-18; 24-29; 52; 72-80.
